Gokhan Gureser
PMP, LSS MBB, ASQ CSSBB
Continuous Improvement Expert
Cusum, Shewhart, EWMA Control Charts Comparison
In Statistical Process Control (SPC), a variety of control charts have been applied including Shewhart, CUSUM and EWMA (e.g. Montgomery, 1991; Wetherill and Brown, 1991). Each method has associated advantages and disadvantages that have been reported in the literature. Control chart performance is traditionally quantified in terms of the Average Run Length (ARL). Run length is defined as the number of observations from the start of the control chart to the first out-of-control signal. (Montgomery, 2010)
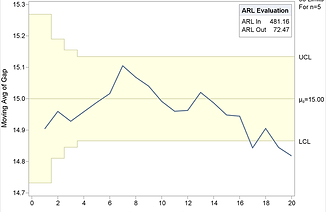
The EWMA chart offers a flexible instrument for visualizing imprecision and inaccuracy and is a good alternative to other charts for detecting inaccuracy, especially where small shifts are of interest.
Where the Shewhart chart takes only the immediate control into consideration, the EWMA chart uses the previous values also.
In brief, after multiplication by a weighting factor w, the current measurement is added to the sum of all former measurements, which is weighted with (1 − w).
Thus, the EWMA control chart differs from the similar Cusum chart by using the additional weighting factor, which allows the adjustment of shift sensitivity. (Setting the EWMA weighting factor w = 1 yields a Shewhart control chart.)
Work Done
In simulation, independent, random normal distributed data is to be created.
Approximate ARL will be 500 and 1000.
For CUSUM and EWMA, ARL 500 and 1000 will be determined by adjusting the different parameters.
After determining the parameters, find ARL1 performance for various mean shifts 0.5 Sigma and 3 Sigma.
Comment on the results and compare three types of control charts.
ARL 500:
ARL 500 means that the average run length will be 500 for selected parameters, at the case that no shift from mean realized. For instance, Shewhart chart ARL 500 almost corresponds to plus and minus 3.095 sigma control limits.
Shewhart
Shewhart is the most basic control chart that only considers the individual measurements. Thus, it has some shortages such as not able to detect cumulative deviations. In this context, Shewhart CC is non-sensitive to small shifts from mean. Whereas others essentially CUSUM detects quickly, because CUSUM considers cumulative sum of deviations. Shewhart is merely useful comparing CUSUM and EWMA at high shifts i.e. 3 standard deviation or more.
CUSUM
Key parameters of CUSUM are k and H.
Basically H represents the standard deviation whereas k shows the one-half of the expected shift. Therefore, it is expected to perform well at 1sigma shift levels. H represents the decision interval and we took H as 5.1 and 5.8 to satisfy 500 and 1000 ARL respectively.