Gokhan Gureser
PMP, LSS MBB, ASQ CSSBB
Continuous Improvement Expert
Phenol Formaldehyde Resins Efficiency Improved by production settings Optimization / DOE
In production operations, total cost of binder was more than 4 Million Euro and the overall efficiency was 64%.
The Case
When lean six-sigma deployment started as CEO initiative in the organization, the binder consumption was one of the vital items on the agenda. In production operations, the total cost of raw material was more than 4 million euro and the overall efficiency was 64%. I was project leader in this project to enhance binder handling ability of the organization and reduce waste.
Objective
The objective of the project was to improve raw material conversion rate (efficiency) maintaining essential properties of the end products in the selected range of products.
Work Done
The essential part of define phase already cited by previous program and the CTQ ’s and y were predetermined. The y was efficiency. Thus, the scope of the project was very broad and time schedule was long like nine months for this project. Inputs and outputs are defined for the process.
In measurement phase, the baseline procedures were already set up. The objective was to decrease variation using six sigma tools and decrease waste using lean tools.
In the project, an intensive measure, analysis and improve circle applied. The variation stem from many factors and all these factors was determined and analyzed. Apart from that, relationship between two different parameters was figured out.
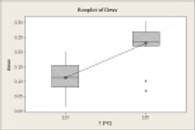
If we take the whole process as a production system and assume that the recycle processes are inside this system, there are two three different type of output. Thus, the value stream map was created to figure out the value added processes and non- value added processes. Moreover, the variation for the key processes had been found out. These variations can be entitled at a closer range, where some needs technological enhancement like new machines; some needs operational care, like regular checks and missing protocols which gives needless initiative to associates. This variation sources figured out and was decreased by half, as might be seen in the following graph.
In MAIC circle, another improvement made based on a correlation between two parameters. As in the following graph, the correlation between two factors had been found and the improvement made based on this relationship. The correlation shows the amount of flow is correlated with value adding binder.
Result
The correlation between two factors found out and another project was created to go deeper for this correlation.
The variation reduced by half, from 5% to 2.4%, after the project. According to Levene test results.
The standard operating procedures created, in the course of the project, decreased variation in overall operation. The process owners were able and comfortable to predict the outcome more precisely at selected parameters. Moreover, half as in the first graph with a new operating procedures and its trainings reduced the variation.